INTRO WTF am I doing???

wtf-e1510144045161.jpg

My first Blog….. A lot of questions, frustrations and cuss words have led me to this point! What the $#&* is a blog really for? Who actually reads blogs? Which colors will work well for my blog? Can you read the writing on the chosen colors? Does my page flow? Is my page what I want it to be? Am I actually studying accounting? I am not tech savvy!

STAY TUNED!

UPDATE: After reading some exemplars and other blogs, I have decided to keep my blog totally raw and honest, no hugs, kisses and unicorns pooping rainbows, Everyone experiences frustrations and wonders what the hell they are doing! Attacking this with gusto and a sense of humor should keep the mood light! Hopefully you can relate and think “Oh yes!!! I’ve been there,” and maybe even get a good laugh along the way.

Step 8 commentary & Economic profit.

After making my way through the week 9 lecture I had to keep going back to look at my firm’s statements notes. My inventory was actually “stocks and works in progress”. My firm also had two different kinds of shares ‘A’ and ‘B’ both of different value, I added them together and went for an average, this can be viewed when you click on the formula. I also have a different formula where total assets were used, as I didn’t have current and non-current assets listed as total assets in my financial statements, my formula adds them together. After looking through my firm’s report I decided to use the 10% cost capital figure as Swire’s ranged from around 8% through to 12%. I also had to revisit Swire’s website to find the share market price along with the number of shares issued.

Profitability Ratios:

When looking at Maria’s example of Wesfarmer’s profit margin in 2016, I realized I needed to research the Hong Kong Dollar to find out if it is broken up into cents or something different, there is 100c to the Hong Kong dollar (similar to the Australian dollar). In 2013 Swire turned every dollar of sales into 32.4c profit, the profit dropped in 2014 to 21.8c then rose again in 2015 to 27c and then falling again in 2016 to 20.7c. Even though the revenue in 2013 was the lowest it was the year that was the highest profit margin, 2013 had the lowest overheads (operating costs), lowest taxation and the lowest costs of sales giving it the best profit margin. So far, the profit margin is a good indicator of my company’s financial health as a large value for revenue may look good, but it is possible to increase the company’s earnings and decrease profit margins. It appears Swire’s return on assets is also in average shape, 2016 showing the least amount of profit produced relative to its assets for the year, 2016 had the highest asset value which contributed to the lowest return on assets, 2016’s revenue was on par with 2015 and 2014, 2013 was still the best performing year returning 4.8% for every HK$1 of Assets.

Efficiency (or Asset Management) Ratios:

Swire’s days of inventory range from 35 to 45 days across the four years, although Maria thinks this is quite high for her firm Wesfarmers, for my firm Swire this is actually quite good considering most of the inventory is in property development where they would have a longer turnaround time to the time of sale, the quick sale of Coca-Cola products would be bringing the average days of inventory down, as soon as the Coke is bottled it is sold and shipped out. Swire’s asset turnover ratio is relatively low turning every $1 HK dollar in assets into around 17c of sales. Initially this looked extremely low and possibly wrong, it is however due to the fact that Swire has an extremely large asset base and slowly turns over their assets through sales. Another cause can be that Swire is not using their assets efficiently, such as property not being utilized and sitting idle. Cathay Pacific would also be contributing to this low asset turnover ratio due to its large asset base (such as planes, machinery infrastructure) and its very low revenue (losing $2.1 HK billion in the first half of 2016). Swire’s asset turnover ratio has remained stable through the last 4 years suggesting this is the norm for the industry/sector they are in.

Liquidity ratios:

How well can my firm pay for its liabilities with its assets? In 2016 Swire was only just scraping through with its ability to pay for its liabilities with its assets at 1.02, for every $1 of liabilities. The ability to cover short term debts in an emergency was only just there in 2016, the average of $1.25 creating a better financial position for 2015, 2014, and 2013. So, what happened in 2016, why did it decrease? The large decline in 2016 is mainly due to the reduction in current assets, namely the bank balance. The large losses in 2016 in Cathay Pacific would be the contributing factor

Financial Structure Ratios:

Swire’s debt/equity ratio has remained stable for the last four years at an average of 28c, this shows they haven’t been overly aggressive in financing their growth with debt. For every dollar the equity owners are putting in, an external source such as a bank is putting in 28c. Swire’s equity ratio is sitting in the range between 72% and 76% for the last four years meaning it is funded by an average of 74% from equity, this is representing the amount of assets on which shareholders have a residual claim in the event of liquidation. Swire’s debt ratio is calculated using the equity ratio values which gives Swire an average debt ratio over the last four years between 24% and 28%. Over the last four years Swire’s debt ratio has remained under 30% which is a positive sign and shows stability.

Market Ratios:

Swire’s earnings per share had the best year in 2015 at $4.21. Originally, I thought this was pretty low until I looked around at other company’s and realized it is actually quite good from a shareholder’s point of view. Swire actually has two share values A and B; this figure is an average of the two. Swire’s dividends per share is also quite good and has increased from .42HK dollar in 2013 to 1.73 HK dollar in 2016, making shareholders very happy! Swire’s price earning ratio was relatively stable from 2013 to 2016 with what looks like an extreme outlier in 2013, upon further investigation it is actually due to the low EPS (earnings per share) in 2013, the contributing factor to the low EPS is due to the fact there were a larger number of issued ordinary shares in that year.

Ratios Based on Reformulated Financial Statements:

Swire’s ROE is looking pretty healthy especially in 2013 showing a substantial 7.7%, providing investors with insight into how Swire’s management team is managing the equity that shareholders have contributed. RNOA is also at a healthy rate showing how well Swire is using its operating assets to create profit. NBC (net borrowing cost) has remained steady over the last four years with the average rate Swire is paying on its financing sitting around the 5% mark. Swire’s PM (profit margin) is expressed as a percentage and is measuring how much out of every dollar of sales Swire keeps in earnings. The figures seem excessive, especially in 2013 with a PM of 42.56%. The ATO (asset turnover) for Swire is very low, this confirms my research that companies with high profit margins tend to have low asset turnovers and companies with low profit margins have high asset turnovers.

Economic Profit:

Swire’s economic profit is a negative number for the last four years, it jumped rather drastically in 2014 and has been decreasing since (decreasing as a negative number towards zero, therefore it is increasing). Surely a negative economic profit is bad? The three main drivers that contribute to Swire’s economic profit are, RNOA, cost of capital, and the amount of NOA invested, the cost of capital is often called “weighted cost of capital (WACC). RNOA has two key drivers of its own, PM (profit margin) and ATO (asset turnover). My WACC of 10% is contributing to my negative PM. If I could decrease my NOA to a lesser amount than that would increase my RNOA value, if my RNOA decreased enough to a number greater than my WACC I would be generating a positive PM. I have been back through the restated financial statements to see if I can rearrange anything and I cannot. So negative PM it is.

ASS 2 STEPS 3&4

step 3,4

So, After still not nailing the flippin KCQ’s at a mark of 3.5/5, (twice in a row mind you) I cannot say I am super pumped to be doing more Accounting assignments! At first glance the restating task did not look too bad, until I had to decipher the study guide and lecture videos. I really feel as though I am blindly teaching myself accounting concepts. The general task seems straight forward but with not a lot of guidance on how to decipher what the footnotes mean is rather frustrating and quite possibly makes this subject the worst! I am actually forcing myself to do the work for a pass!

SPREADSHEET LINK:  Swire Pacific Spreadsheet 2017

ASSIGNMENT #1 – KCQ’S

Swire

After looking at my original my blog section “MY COMPANY” I decided it was getting over crowded and long winded, so I cut and chopped and hacked at it to create this second blog post with the relevant information to Assignment #1.

Links to Swire’s annual reports are listed below:

2016 Annual Report: http://www.swirepacific.com/en/ir/ar16_download.php

2015 Annual Report: http://www.swirepacific.com/en/ir/ar15_download.php

2014 Annual Report: http://www.swirepacific.com/en/ir/ar14_download.php


KEY QUESTIONS:

For someone new to accounting the annual reports are over-whelming, they consist of over 220 pages per report. Where do I start? I am concerned that I could be looking at these numbers and unfamiliar terms for a long time to make heads and tails of it. So far I have not found EBIT on my firms annual reports. After watching Maria’s lectures from weeks 3 and 4 and finding out my firm could call their statements other names I had to work out what reports were called and where they were located. My balance sheet was in fact called “Consolidated Statement of Financial position. One thing I really liked about Swire’s annual reports was the option to click on certain sections of the annual report and generate that part of the report with out having to scroll to the 200th page. Swire’s currency is in the Hong Kong dollar, the annual reports are in (millions), how much is a HK$? A HK$ is currently equal to approximately 17 Australian cents, which makes Swire’s 2016 Total Equity of 272,168 (million) HK$ equal to approximately $46,268 (million) AUD.

After reading the study guide chapters and carefully following through Maria’s lectures I found Swire’s;

  • Consolidated Statement of Changes in Equity
  • Consolidated Statement of Financial Position (balance sheet)
  • Consolidated Statement of Profit or Loss & Consolidated Statement of Other Comprehensive Income, (income statements split in two)
  • Consolidated Statement of cashflow.

Originally, I was unsure if my income statement was split in two. The information on my Statement of Other Comprehensive Income didn’t seem to be sufficient so I went back to the annual reports to look for an Income Statement, I found a Consolidated Statement of Profit and Loss where my profit value at the bottom equaled the profit value at the top of my Consolidated Statement of Other Comprehensive Income (Thanks Maria, Lecture 3 & 4). Still unsure if this was what I was needed I researched it and found that although profit and loss is not normally a part of an income statement, they can be merged together (rare to see), It is now included in my excel spreadsheet. Even though I didn’t need the cashflow statement for my step 4 spreadsheet I decided to view it as it is one part of the four-general purpose financial statements.

Something that really resonated with me was that Swire has an Equal Opportunity and diversity council. I currently sit on the steering committee for inclusion and diversity within BHP. if done correctly it can be a very powerful and successful tool to create great culture, safety and productivity. Click the link to view Swire’s diversity video: http://www.swirepacific.com/en/media/video_content.php?clip=27

There are also a lot of accounting terms I don’t understand such as “derivative financial statement and perpetual capital securities”, even after reading about them in the notes section.

KEY CONCEPTS:

Assets = Equity + Liabilities

2016:

Assets = 373,498 (346,945 + 26,553)

Equity = 272,168

Liabilities = 101,330 (75,183 + 26,147)

Does the equation work? 373,498 = 272,168 + 101,330.  YES!

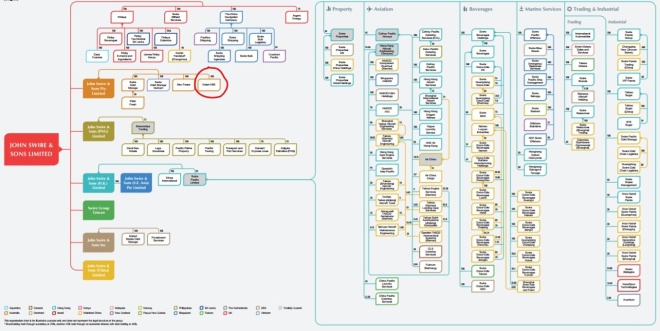
Swire clearly has a good grasp of all their sectors, their total equity and cash flow increases from year to year, They are constantly acquiring new ventures, building new property developments and new factories. Swire has some non-controlling interests shown on the bottom of the balance sheet, which have stayed at approximately the same value for four years.

When I first viewed Swire’s cash flow sheet after the rest of their financial statements, it appeared as though they didn’t have a lot of cash in their bank balance! It was only 6,450 HK$M, my initial thought was that was no where near enough for such a massive company! Especially when all their other amounts are so high, eg: 2016 Total Equity = 272,168 HK$M. I calculated the conversion and it was approximately 1,096 million $AUD! I am pretty sure that should carry them through!


CRITICAL BUSINESS AREAS

Being so diverse on a global scale a number of macroeconomic conditions are a major factor for Swire. Currency, tourist industry down turn, terrorism, coal glut and the list goes on!

The critical business area is the Property Sector with the majority of  Swire’s cash flow coming from their property assets, (as shown in the graph below). If one of the other sectors has a loss/negative cash flow the property sector can prop it up, but what if the property sector takes a loss? Swire is one of Hong Kong’s largest commercial landlords with 12.3 million sq.ft. of lettable space and another 2.3 under development.

cash flow swire


KEY CHALLENGES

Some of the key challenges for Swire is in the airline business, with such a fierce competition from other companies, oil prices and the current strength of the Hong Kong dollar. Part of Swire’s strategy plan is to increase maintenance resulting in less breakdown times, enhance high standards of service to the passenger and endeavoring to minimize the effect on the environment. Swire has already increased their cash flow from 870 HK$M in 2015 to 1,198 HK$M in 2016, showing their improvement strategies to be effective.

Other key challenges would be making sure they have the right management in place. with so many subsidiaries it would be hard to keep their finger on the pulse and to make sure all sections are pulling their weight.

WEEK 1. MY COMPANY – SWIRE PACIFIC

swire 2

WHO IS SWIRE PACIFIC?

For those reading who don’t recognize the name Swire Pacific, they started as a modest import- export company from Liverpool and are now an international conglomerate with investments in aviation, property, beverages, marine services and trading. Some of the names you may recognize; Cathay Pacific, Coca-cola, Colgate / Palmolive and for those local to the Bowen- basin in Queensland HSE / Kalari.

hse kalari

Kalari transports explosives to various mine sites, HSE on the other hand is a mining contractor consisting of mainly truck shovel fleets. HSE is close to my heart as I have worked for them years ago, they are now the primary contractor for the mine site where I am employed as a supervisor by the principle company.

The link for Swire Pacific is; http://www.swire.com/en/global/home.php

From my current mining position at work I know Swire own our main mining contractor- HSE/Kalari, due to the magnitude of HSE/Kalari in the Bowen Basin Swire must be of considerate size. So, How big? A quick search revealed 844 employees in Australia and over 90,000 employees globally. Swire’s website displayed all their subsidiary companies in an org chart which was mind blowing, I have circled HSE/Kalari in red on the org chart below, for a sizable company HSE/Kalari are rather small in relation to their parent company Swire! The org chart shows large names such as Cathay Pacific, the bottling of Coca-Cola, Palmolive & Colgate (PNG) to name just a few! My initial thoughts were on how diverse this company is, not many companies can say they own cruise ships, mining as well as bottle coke! As it turns out diversity is their key concept, outlined in a video on their site:   http://www.swirepacific.com/en/media/video_content.php?clip=5


Swire Org Chart: All subsidiaries, HSE/Kalari circled in red

Inkedorg chart_LI


Links to Swire’s annual reports are listed below:

2016 Annual Report: http://www.swirepacific.com/en/ir/ar16_download.php

2015 Annual Report: http://www.swirepacific.com/en/ir/ar15_download.php

2014 Annual Report: http://www.swirepacific.com/en/ir/ar14_download.php